
How Much Inventory Do You Really Need?

How Much Inventory Do You Really Need?
A few years ago, I implemented an SAP? ERP system for a subsidiary of an Australian arms manufacturer. The company was setting up a manufacturing plant in Tucson, AZ. The Iraq war was at its peak. It was mandatory that the company manufacture their product in America, and they needed to ramp up production fast to produce enough to support our forces in Iraq.
During a requirements-gathering workshop, the plant manager told me that companies producing similar products turn their inventories at three. He wanted to turn his at six. What processes did he need to make that a reality? (As you probably know, a ?turn? is a technical term in inventory management that measures how fast you convert raw materials into finished products. The larger this number, the lower the inventory; e.g., a turn of four means that the raw materials procured today will get converted into a finished product in three months because the inventory turns four times a year).
I had spent over a decade consulting on various ERP solutions for manufacturing enterprises, and I had hands-on experience implementing supply chain solutions for enterprises large and small that employed a smorgasbord of industry manufacturing processes: discrete, repetitive, process, you name it. And no one had ever challenged me with such a basic question before.
I was familiar with best business practices for his industry that were supported by the SAP? solution, but they were all push-driven practices. I wasn?t sure if implementing them would mean he?d be turning his plant at six.
Planning in an MRP/APS-driven push supply chain is always a reactive exercise. You can never tell for certain how much inventory you really need. Inventory management in such an environment is really a hide-and-seek game that we all keep playing until one day when we can?t hide anymore and are forced to write it off.
It is also a blame game between operations and sales. You?ve probably experienced sales being blamed for bad forecasts. Then there?s the big ?forecast improvement? project after the large inventory write-off. Advanced forecasting tools are acquired, new forecasting models are rolled out, and a few months later people are back to forecasting with manual spreadsheets.
I knew that I needed to implement some form of pull system for this plant if it was going ?to be run at a predefined turn. You cannot plan or budget for inventory level in a push environment, but you can in a demand-driven pull or LEAN environment.
So how much inventory should you budget for if you are using KANBAN/ROP (Reorder Point) to manage your supply chain? Surprisingly, most of us have not given this question much thought. Many of us think it is the sum of KANBAN/ ROP sizes? Really?
I have come across many supply chain managers who do not want to implement a demand-driven pull system simply because they believe they will have to carry too much inventory in the buffers. They are also concerned that they will be left with tons of inventory in their KANBAN/ROP buffers when the product is discontinued.
Can you carry near-zero inventory in a KANBAN/ROP environment? Most of us think not. Worse, we think it is possible in an MRP/APS-driven push environment.
Let?s look at why organizations need inventory. One of the critical reasons you carry inventory is to service demand variability in your supply chain. The more the variability, the more inventory you need.
The size of KANBAN/ROP for material on a supply chain node is typically calculated as shown below.
KANBAN/ROP size = Statistical Inventory Size (SIS) + Demand over Lead Time.
Equation: [1] ? Calculating inventory buffer sizes
SIS (Statistical Inventory Size) is a function of the variability of the demand and the level of service of a product on a node. The higher the variability and / or service level, the higher the SIS.
While the inventory used to cover the requirements ?in lead-time in the above equation constantly gets consumed by the actual demand, the SIS portion of the buffer stays in the inventory to service the variability.
Hence, statistically, SIS is the amount of inventory you must carry to support your supply chain in a pull environment. Figure [1] displays this relationship.
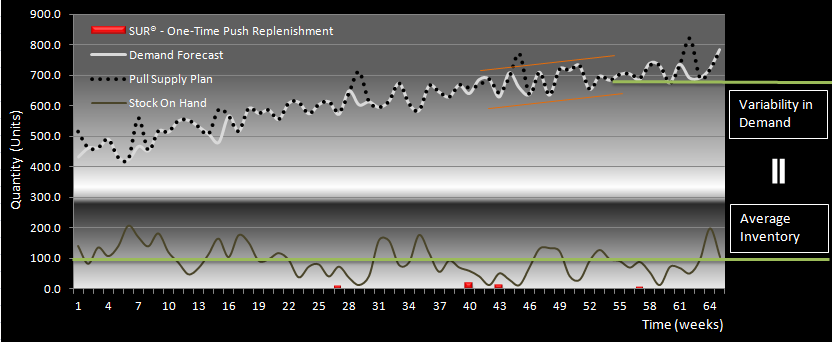
Figure [1]: Average inventory carried in a pull supply chain is directly proportional to the variability in demand.
If the variability? is close to zero, the SIS is also close to zero.
Hence it is possible to carry near-zero inventory in a pull environment.
Equation [1] also shows that the size of KANBAN / ROP can be a large quantity if the demand over the lead-time is high. But it doesn?t necessarily mean than you need to or will carry a large inventory. ROP/KANBAN size is never indicative of average inventory carried.
Therefore, the sum of SIS across all the materials on a supply-chain node is the amount of inventory you need to carry. The sum of the demand over a twelve-month period divided by the sum of SIS is the inventory turn of a supply-chain node. Well? in real life, you probably have to fine tune this equation to compensate for the demand trend and the amount of variability itself
But in principle, if you have a system that calculates SIS on a rolling basis over the planning horizon, you have a pretty good idea how fast you will be turning your inventory in a pull environment.
In a push environment, the safety stock plays a role similar to SIS in the equation above. Safety stock is the buffer inventory that is supposed to compensate for the variability in the demand. These days people deploy multi-echelon inventory optimization solutions just to calculate the optimum safety stock of products on different nodes of a multi-tier supply chain.
So, in an ideal push supply chain, the sum of the safety stock for all the products on a node should be the average inventory level that you should carry. At least in theory!
Unfortunately, this is never the case in practice.
There are two primary reasons for this.
[1] The replenishments in a push environment are triggered ahead of time. You are constantly reacting to the dynamic demand forecast, and its accuracy determines how much excess inventory you carry. We tend to be overly cautious in a reactive environment and build more than necessary. This is reflected at every level and every node of the product structure on the supply chain. As a result of this bullwhip effect, the actual inventory is always excessive and never close to the safety stock.There is no such bullwhip effect in a demand-driven pull supply chain.
[2] Unlike SIS, safety stock is additional inventory that the MRP/APS system always plans to have on hand. The system always replenishes any consumption from the safety stock. SIS, on the other hand, is a part of the planned inventory buffer. The replenishments are always triggered by the KANBAN/ROP size, and it is OK to dip into SIS inventory if need be.Hence, unlike in a pull system, a near-zero variability does not result in near- zero inventory in a push system.
You can always forecast inventory requirements far more accurately in a pull than in a push environment. The more you smoothen your variability, the lower the level of inventory, and the more accurately you can forecast your required reserves.
What if you switch to a pull system today? What will the impact on the inventory be? Can you forecast or budget for your future demand?
As explained in my blog posts ?Can You Plan Using Push and Execute Using Pull?? and ?Demand Spikes ? How to Service Them Effectively,? our LEAN PLANNER? and Single Use Replenishment (SUR?) solutions together make it possible for you to plan any product on any node of your supply chain using pull. As you know, SUR?s are one-time push replenishments created to service demand spikes. The more SUR?s in your supply chain, the closer you are to a push system, and the less predictable your inventories will be. You can either bump up your inventory buffers or smooth the variability to reduce the number of these one-time replenishments and increase the predictability of inventory levels.
In a future blog post I will discuss how you can identify inventory optimization opportunities if you switch to a pull environment today. I?ll tell you how you can create the perfect balance between push and pull to begin with, and then work with your customers, suppliers and sales team to smoothen variability and move towards a better LEAN state.
We applied this technique to solving the Australian arms manufacturer?s challenge. We analyzed the demand profiles of many different products. We performed a what-if analysis using various planning parameters to determine the optimum level of pull and push that we needed to apply.
We concluded, that inventory could be turned between 5 and 8 for this plant. Based on the level of pull, the turn of five was certain.? To turn at eight, the intermittent spikes in the demand forecast had to be at least 80% accurate, but the plant manager now had a list of products, customers and vendors that he could work with to smoothen variability. He was well on his way to achieving his inventory target.
It is much easier to forecast and budget for inventories in a demand-driven multi-echelon pull environment. It is worth switching to pull just for this reason…today!
What do you think?
Ranjan Choudhary is a founding director at Lean Axis (www.LeanAxis.com).? From LEAN business strategy to its implementation on SAP?, Lean Axis combines LEAN industry experience with SAP? implementation expertise to create solutions that bring real, tangible business value with rapid return on investment. He can be reached at rchoudhary@LeanAxis.com.
LEAN PLANNER? and Single Use Replenishment (SUR?) are patent-pending planning solutions available from Lean Axis (www.LeanAxis.com) as SAP? bolt-on applications.